
It's never too early to use distributed tracing
Recounting my experiences adding OpenTelemetry to a project in 2025, my experiences doing a little debugging, and why I wish I'd done it a lot sooner!


Last week, I instrumented my current project with Opentelemetry and I wish I’d done it months ago! This post will recount my experiences along with some of the tools and patterns I’ve been using so far.
I’ve been building Ocuroot for about 6 months now, and at first, performance wasn’t something I thought a lot about. I’ve tried think ahead to avoid backing myself into a corner, but I wasn’t too concerned with page load times. I guess I imagined that would be a problem for some far-off time when I had more users and data. I was surprised to discover just little data I actually needed for it to have an impact.
In recent weeks, I’d been noticing that some of the web UI was feeling a bit sluggish in production. Not so much it was unusable, but enough to be unsatisfying. The worst offender was loading about ~200 rows in a table, which didn’t seem like a whole lot. It was time, I needed traces.
Adding Tracing in 2025
I’d been putting off setting up OpenTelemetry in Ocuroot largely because it always felt like a big task. Previous projects had ended up with conflicting dependencies and similar snags.
This time, though, I was very pleasantly surprised! OpenTelemetry has come a long way in the last year or so, and not only was the setup largely trouble-free, the SDK is now at a point where you can set up traces, metrics and logs (beta) more or less in one shot.
That said, my focus was traces, and I started with the Getting Started guide for Go. It walks you through an example app and gets you to a point where you can see telemetry being streamed into standard output.
A Local View
The standard output can be a good indicator that you’ve got things mostly working, but I found it to be a bit unreadable, so I pretty much immediately started up an instance of Jaeger:
docker run --name jaeger \
  -e COLLECTOR_OTLP_ENABLED=true \
  -p 16686:16686 \
  -p 4317:4317 \
  -p 4318:4318 \
  jaegertracing/all-in-one:1.35
This gave me something locally where I could stream some traces and while it was a little annoying to have to keep refreshing to see the new ones, it meant I could see their structure pretty nicely.
Example Code
After working through the guide and subsequent instructions for sending traces to an OTLP endpoint, I ended up with something similar to the below snippets.
It’s worth noting that Ocuroot is a standalone binary, so I’ve not yet been exercising propagation of traces across service boundaries.
Server Setup
First of all, OpenTelemetry needs to be configured during server startup. The below example is similar to what you’ll find in the getting started guide, but updated to send to an OTLP server over http.
By default, all traces will be sent to localhost:4138, which my Jaeger instance was listening on.
import (
    "go.opentelemetry.io/otel"
    "go.opentelemetry.io/otel/exporters/otlp/otlptrace/otlptracehttp"
    "go.opentelemetry.io/otel/propagation"
    "go.opentelemetry.io/otel/sdk/resource"
    "go.opentelemetry.io/otel/sdk/trace"
    semconv "go.opentelemetry.io/otel/semconv/v1.26.0"
)

// === cut here ===

// Select the target OTLP server
host := os.Getenv("OTEL_EXPORTER_OTLP_ENDPOINT")
if host == "" {
    host = "localhost:4318"
}

// Connect to the selected OTLP server
exporter, err := otlptracehttp.New(
    ctx,
    otlptracehttp.WithEndpoint(host),
    otlptracehttp.WithInsecure(),
)
if err != nil {
    return nil, err
}

// Mark telemetry as having been emitted by this service
res := resource.NewWithAttributes(
    semconv.SchemaURL,
    semconv.ServiceName("my-service"),
    semconv.ServiceVersion("x.y.z"),
)

// Configure the tracer provider, this is what will handle
// all of our traces
tp := trace.NewTracerProvider(
    trace.WithResource(res),
    trace.WithSampler(trace.AlwaysSample()),
    trace.WithBatcher(exporter),
)
otel.SetTracerProvider(tp)

// Set up propagation between services
otel.SetTextMapPropagator(
    propagation.NewCompositeTextMapPropagator(
        propagation.TraceContext{},
        propagation.Baggage{},
    ),
)

// Clean up when we shut down the service
defer func() {
    if err := tp.Shutdown(context.Background()); err != nil {
        // ... handle error
    }
}()
Creating spans
Once the server was configured, we needed to send some spans! At its most basic, this just required starting and ending a span within the context of a function.
func myFunction(ctx context.Context) {
   ctx, span := tracer.Start(ctx, "myFunction")
   defer span.End()
For this to work, you need access to a tracer, and we can pull the default one using otel.Tracer(name). To avoid repetition, I fell into a pattern of creating a telemetry.go file in each package:
import (
	"go.opentelemetry.io/contrib/bridges/otelslog"
	"go.opentelemetry.io/otel"
)

const otelName = "github.com/<organization>/<repo>/<package>"

var (
    tracer = otel.Tracer(otelName)

    // Not needed for tracing alone, but included for completeness
    meter  = otel.Meter(otelName)
    logger = otelslog.NewLogger(otelName)
)
This gave me consistent naming within a package, and an easy copy/paste to create a new span. Keeping the file structure consistent also means that it’s easy to create a new telemetry.go file. I just ask my AI code assistant to do it!
A note about context: OpenTelemetry in Go uses the context package to pass information down the stack, so you may also need to ensure that you’re passing this value down through all your calls. If you don’t, you could see traces that just consist of a single function call. Fortunately, I’d already done this for most of my code to help with log output.
Instrumenting HTTP
Luckily, I didn’t have to write too many spans myself to get up and running. There are a bunch of libraries providing pre-canned instrumentation.
I’ve been using Echo as an HTTP router, and instrumenting all my routes only required one line (and an import). See if you can guess which one!
import (
    "github.com/labstack/echo/v4"     "go.opentelemetry.io/contrib/instrumentation/github.com/labstack/echo/otelecho"
)

// === cut here ===

e := echo.New()
e.Use(otelecho.Middleware("my-service"))

// Add routes
Instrumenting SQL
Setting up SQL for OpenTelemetry was a little more work, but not much! I’ve been using Ent as my ORM, so I needed to create a separate SQL connection and wrap it into an Ent client.
import (
	"context"
	"fmt"

	"entgo.io/ent/dialect"
	entsql "entgo.io/ent/dialect/sql"
	"github.com/XSAM/otelsql"
)

// === cut here ===

db, err := otelsql.Open(driverName, dataSourceName)
if err != nil {
    return nil, fmt.Errorf("failed opening connection to database: %v", err)
}

driverType := dialect.SQLite
if driverName == "postgres" {
    driverType = dialect.Postgres
}

drv := entsql.OpenDB(driverType, db)
client := ent.NewClient(ent.Driver(drv))
A Production View
I’ve been using Grafana in various forms for the better part of a decade, so when looking for monitoring tools for Ocuroot, they were high up on the list. The generous free tier sealed the deal, providing more than enough capacity until I had a few active users. Although I later discovered that it was pretty easy to end up with a ton of metrics series when using their default Kubernetes telemetry config.
I already had an instance of Alloy running in my k8s clusters, so it was trivial to point my server at it by setting the right environment variable:
- name: OTEL_EXPORTER_OTLP_ENDPOINT
  value: "grafana-k8s-monitoring-alloy:4318"
Discoveries and Surprises
Getting everything up and running was less than a day’s work, all told! So now the real work could start, figuring out how to make my page loads faster. I made a few requests to generate traces, and jumped into Grafana.
As a first step, I searched for any spans that lasted more than 1s, which should filter down to just the slow calls.
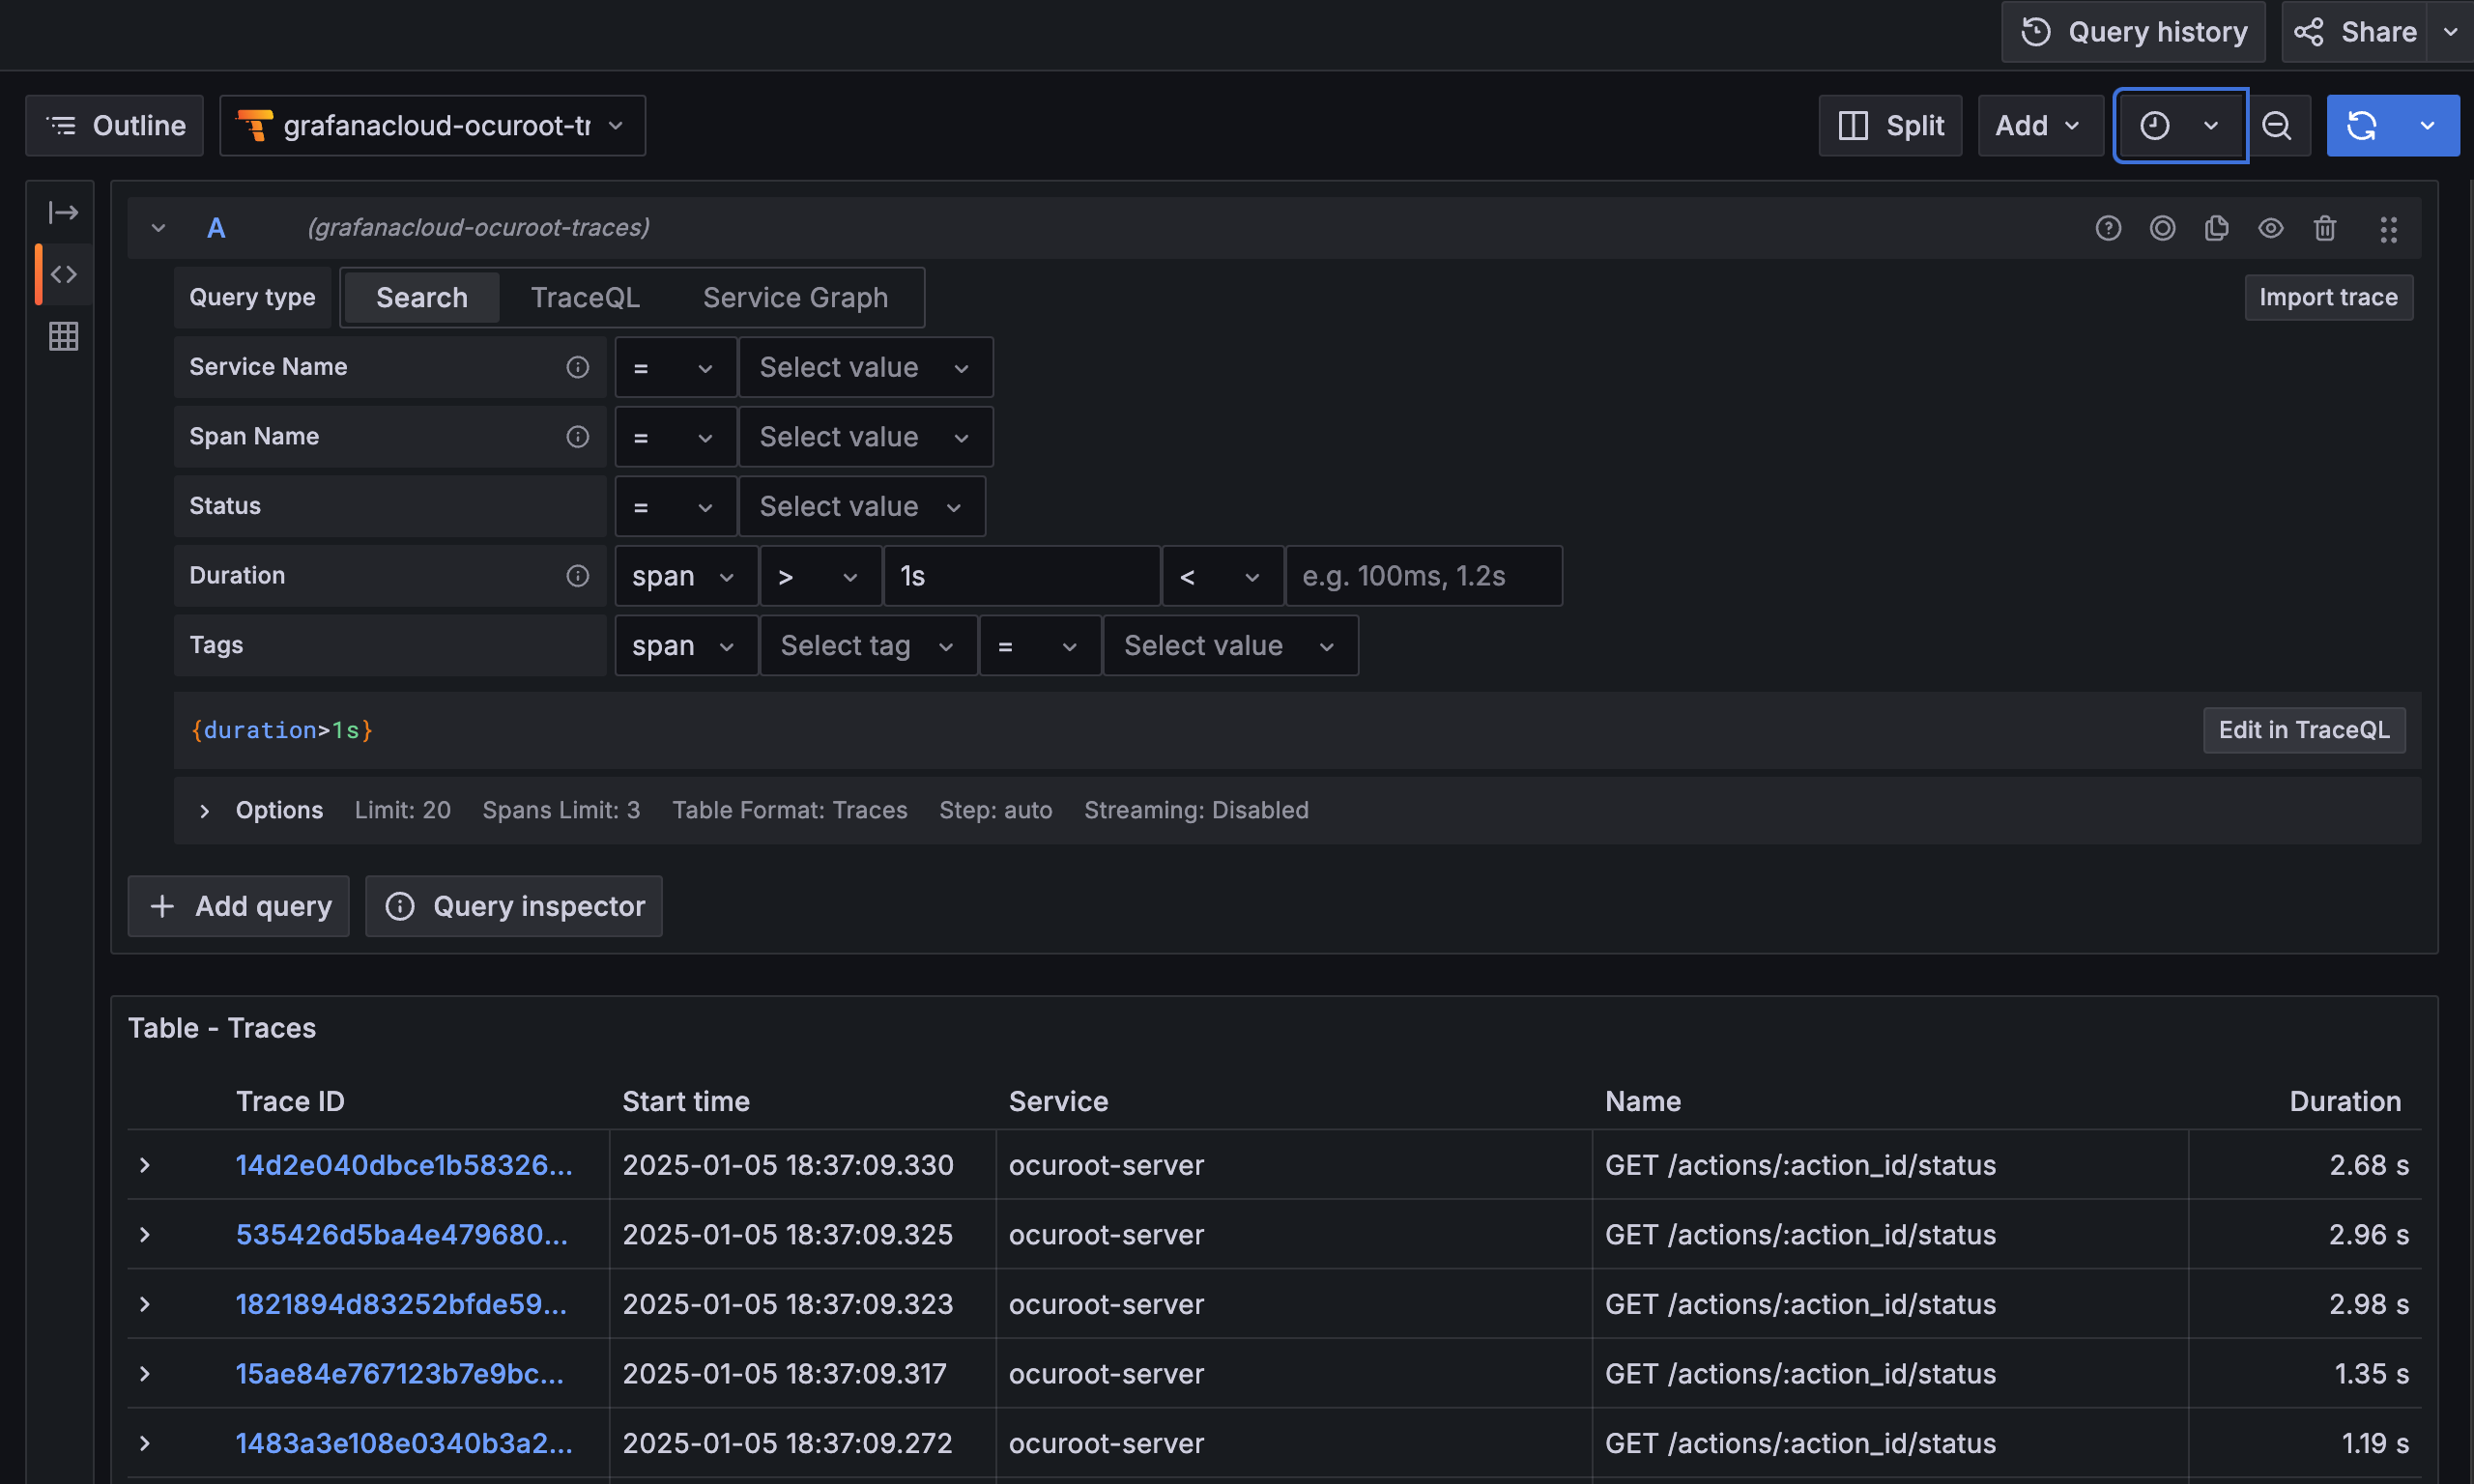
To my surprise, the results were dominated by calls to /actions/:action_id/status, which rendered a badge to indicate whether an operation like a build or deploy had completed. This should have been a very short call, so I was surprised to see so many of them were taking this much time.
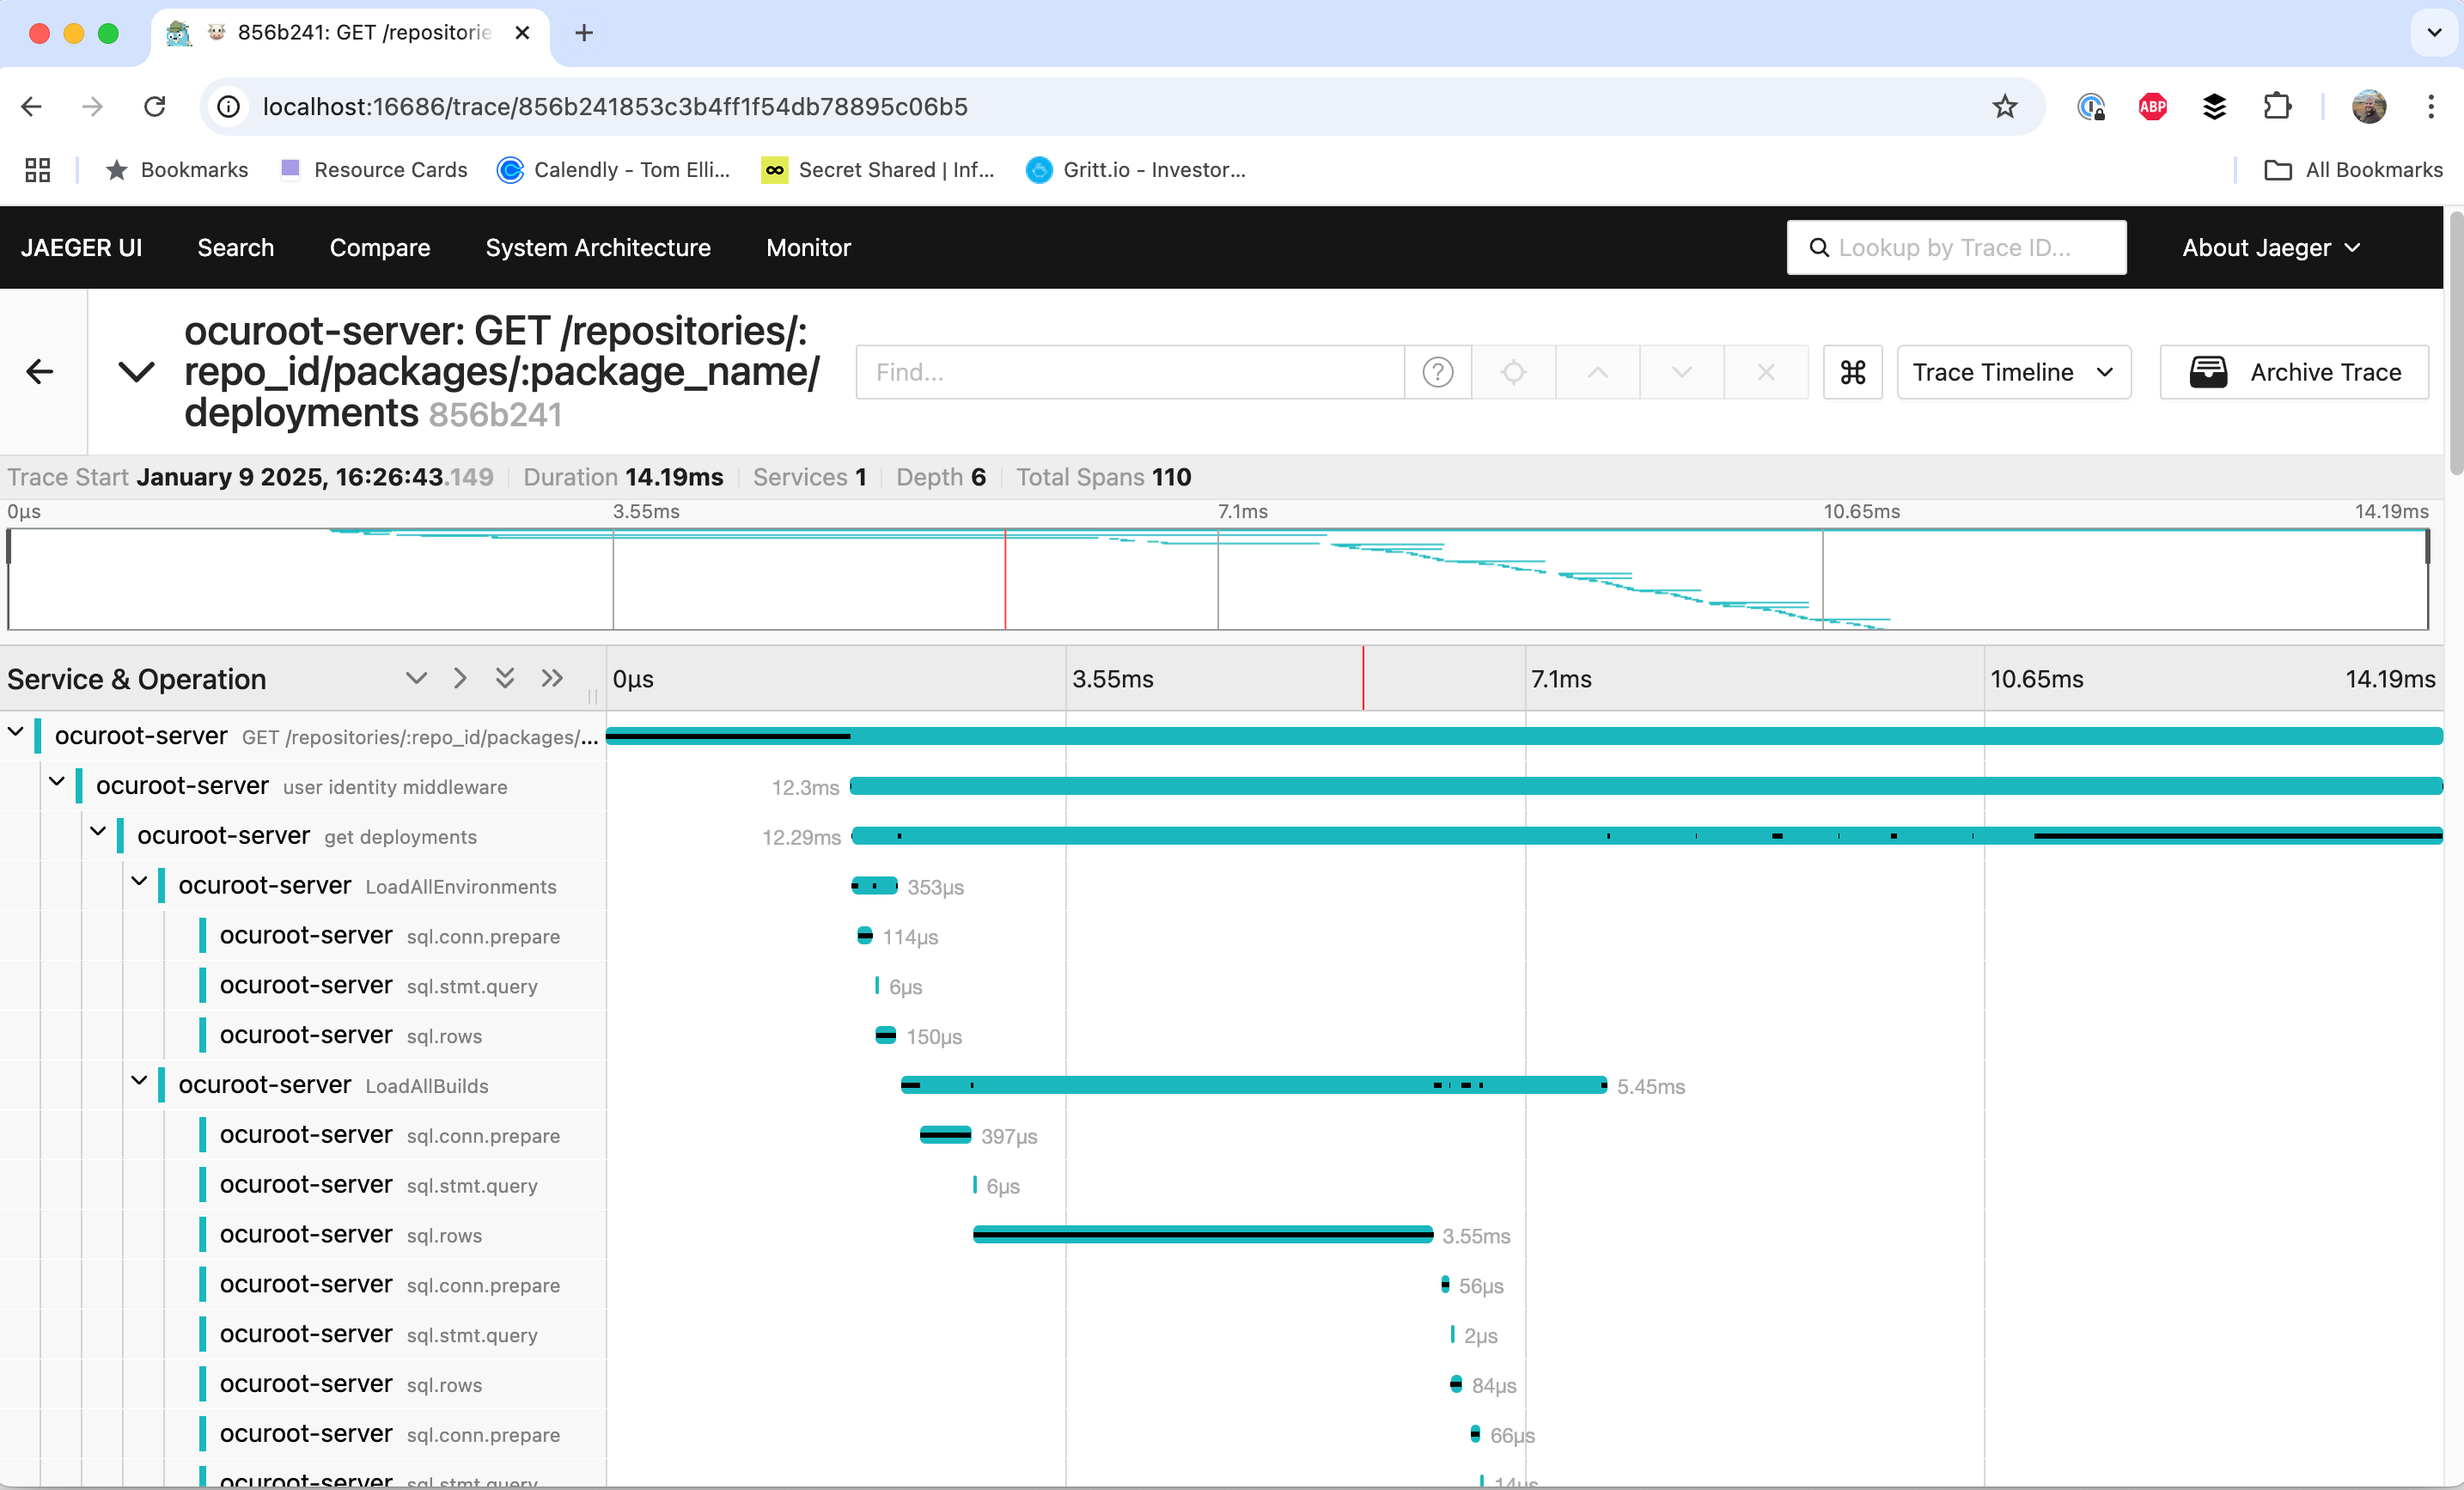
I clicked into the first trace in the list to see what was going on.
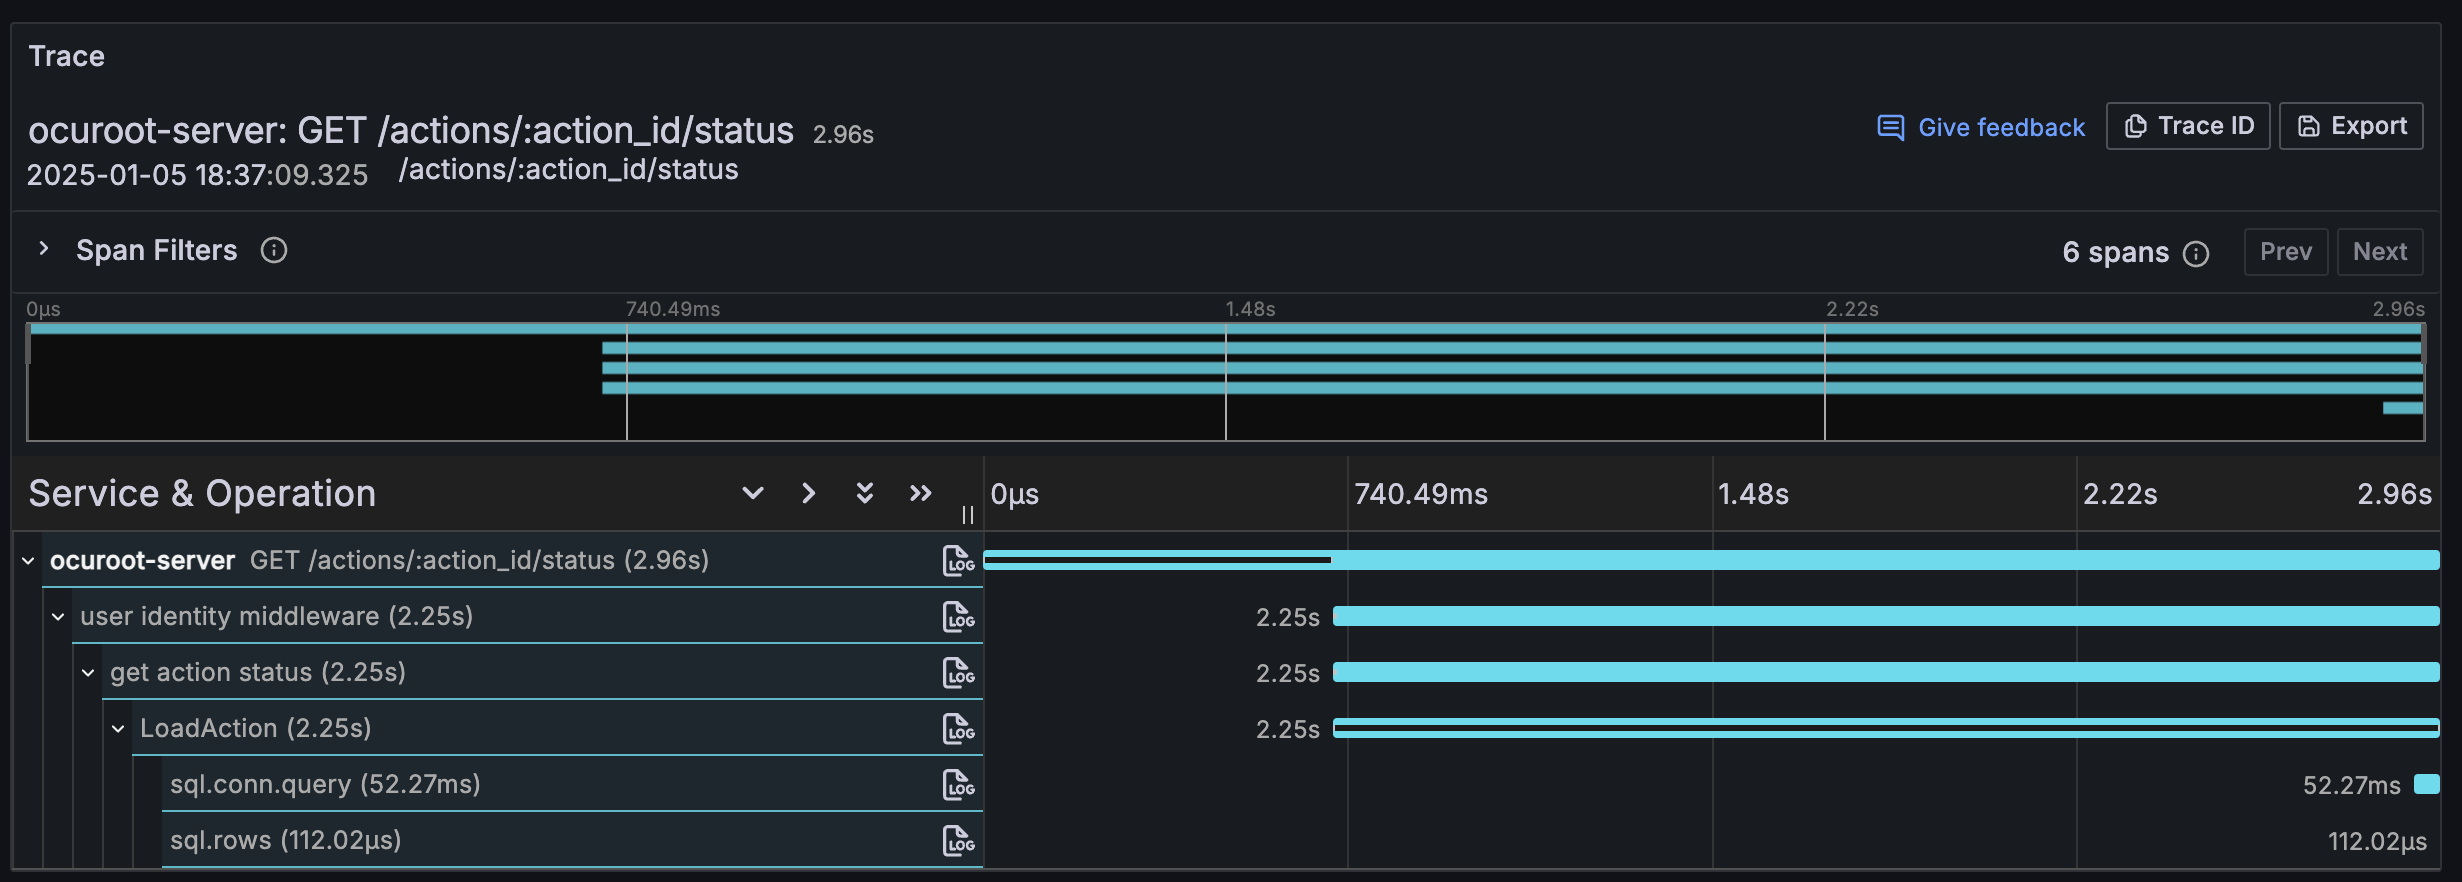
It looked liked there was a huge pause in LoadAction between the start of the function and the execution of the SQL query. I checked to see if there was any work I wasn’t tracing properly, but the function itself was pretty simple.
Eventually, I arrived at a theory. An individual call to load an action was fast enough, but the problem page was making ~200 calls to the endpoint at once! The database was probably only handling a few of these calls at once, resulting in a queue. Doing a little napkin math, it looked like I was getting maybe 4-5 concurrent requests, adding up to a maximum wait of 2-3s.
I probably didn’t need to make this many calls at once for a single page, but if I had any hope of handling multiple users at once, I’d need to make the endpoint itself faster as well.
For the sake of making fewer calls on each page, it was straightforward enough: paginate the table so you could only load 10 builds at a time.
To make the call to load an action quicker, I dug into the code and realized that I was retrieving not only the state of the action, but also its logs. Every single time.
Making the logs an optional part of the query got the action state endpoint down to about 2ms, a 25x improvement! This would mean that 200 concurrent requests for action state would result in a 100ms delay for the unlucky ones, rather than 2-3s.
Of course, an even better solution would be to batch these calls and not trigger so many small database requests to load a single page. But one step at a time 😅
Lessons Learned
Having gone through this exercise, I believe that I might have identified some of these issues sooner if I’d had distributed traces available from the get-go. As such, I’ll be including OpenTelemetry in my future projects much earlier, maybe even as a part of a template.
Not only would it give me an extra tool for catching and diagnosing performance issues up-front, but it would be a good forcing function for code hygiene concerns like context propagation and consistent logging.