
Can Git back a REST API? (part 4 - stability)
My git-backed REST API is performant and can even handle concurrent requests, but is it production ready? Here's how I went about making it stable.


I’ve spent the last couple of weeks building a REST API backed by a Git repo. In part 1, I took the naïve route calling the Git CLI and found performance a bit lacking. In part 2, I hit the server with the HTTP protocol directly and was surprised how fast it could be! I spent part 3 working on supporting concurrent requests. Now I’m putting on some finishing touches to make sure the server can handle long-term operation.
I wanted to run the server and fire off many requests over a long-ish period of time. This wasn’t going to be a hefty load test, more of a soak test with a low but steady flow of traffic. So running locally with Docker Compose would be fine. I needed to keep an eye on request duration and resource utilization, so added Grafana and Prometheus to the config.
The test itself would run for a configurable duration and run a test sequence a set number of times per minute. This repeated test sequence would create two files with POST, GET both of them, PUT a change into one and DELETE the other. The files would contain fixed data on the order of 1kb, and would have random names to the repo would grow over time.
A low volume run
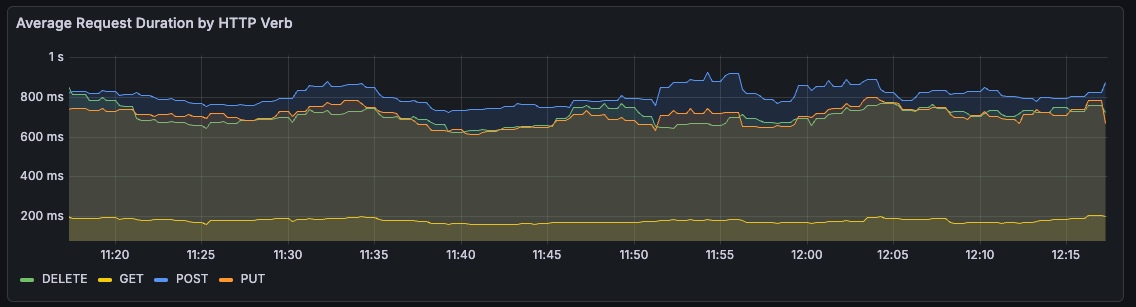
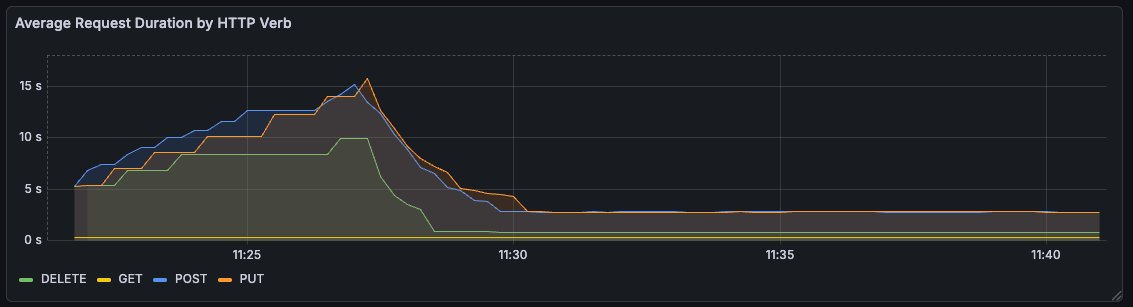
My first run was an hour long, with a single test cycle each minute. Over the hour, the average duration of request was pretty stable, if a bit slow for write operations.
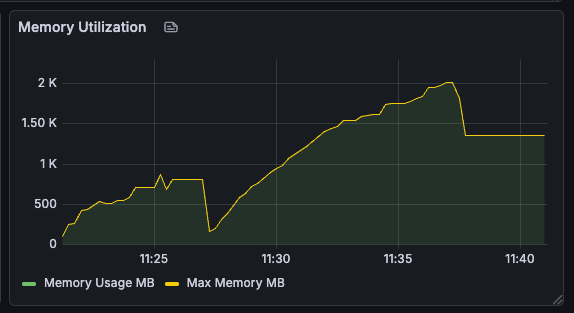
Memory utilization, on the other hand, was a bit of a worry, steadily growing over time.
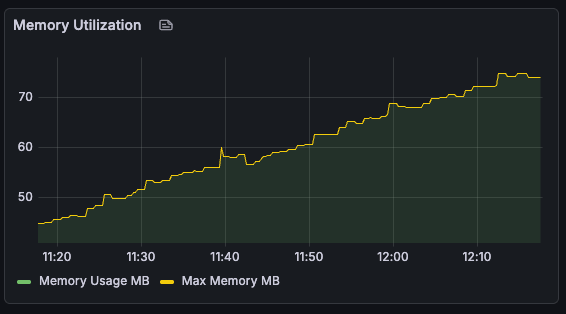
This didn’t seem to have an impact on performance, since the overall usage was pretty low. So I ramped things up to try and push the server to breaking point!
Bigger files, slower requests
I updated the test to accept a flag to create bigger files. Re-running the hour-long test with 1MB files, I saw that not only did memory usage increase, but the time for each request increased as well.
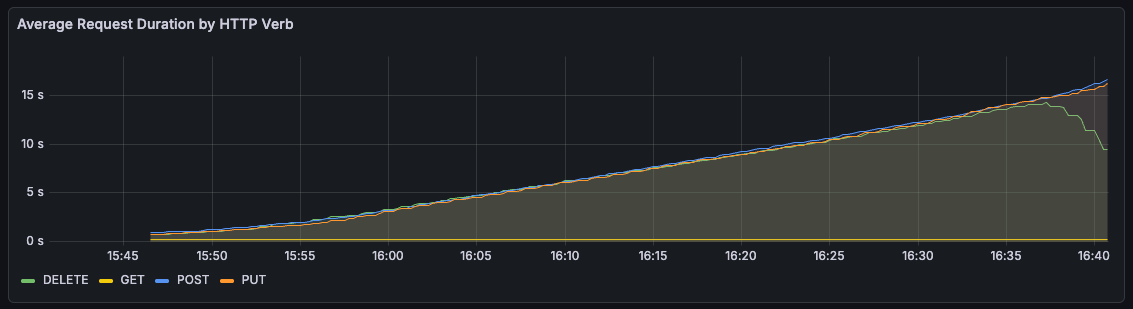
Towards the end of the hour, it even got to the point of HTTP timeouts. This seemed to lock up the server entirely, and all subsequent write requests would time out until a restart.
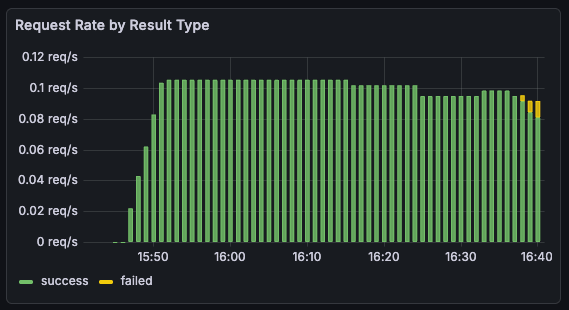
2026/01/05 16:40:16 Action #54 failed: failed to delete second resource: executing DELETE request: Delete "http://localhost:8080/sthenic-Mitella-batlan": context deadline exceededI added Pyroscope to the Docker Compose config to capture profiles sent by the server. This let me see flame graphs for memory and cpu utilization during the course of a test run.
Looking at the cpu profiles, it seemed like the bulk of the time was being spent setting up packfiles.

Git uses packfiles to store and share objects in a space-efficient manner. In the case of pushing a commit, the API server creates a packfile containing the updated objects (commit, trees and blob) to send to the git remote.
Digging into the code, I narrowed the problem down to a mistake in my code to identify objects from a tree to be included in the packfile.
func (b *Backend) walkTree(
  treeHash,
  includeHash func(plumbing.Hash) error,
) error {

...

  for _, entry := range tree.Entries {
    if entry.Mode.IsFile() {
      // Object is a blob, include if it's in our store
      // HERE'S THE PROBLEM
      _, err := b.store.EncodedObject(plumbing.BlobObject, entry.Hash)
      if err == nil {
          includeHash(entry.Hash)
      }
    } else if entry.Mode == filemode.Dir {
      // It's a subtree - recurse
      b.walkTree(entry.Hash, includeHash)
    }
  }

...

}
This was including every previously stored object in the tree, even if it hadn’t changed. So as the object store fills up, the API server was including more and more blobs in the packfile. This resulted in more time packing, and more time sending to the git server.
After a restart, the object store wouldn’t contain any pre-existing blobs and this still resulted in a valid packfile. So I figured it would be reasonable to only include the blob that we were updating in our packfile.
if entry.Mode.IsFile() && entry.Hash == modifiedFileHash {
// Object is a blob, include if it's in our store
_, err := b.store.EncodedObject(plumbing.BlobObject, entry.Hash)
if err == nil {
includeHash(entry.Hash)
}
} else if entry.Mode == filemode.Dir {
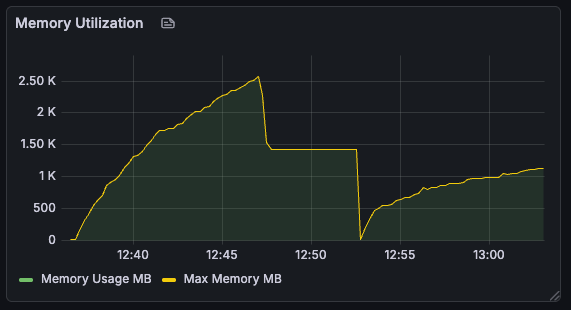
...With this change, request durations dropped down to a steady value, more proportional to the size of the file being updated. For a bit of a faster turnaround, I upped the file size to 10MB, lowered the test duration to 10 minutes, with test cycles every 15 seconds.
Unfortunately, memory usage now ran away unchecked, since every file written was kept in the object store.
Getting memory under control
As a quick and dirty way to manage the growing object store, I added a goroutine that just emptied the store every 10 seconds.
go func() {
  // Clean up objects every 10s
  for range time.Tick(10 * time.Second) {
    b.sessionMtx.Lock()

    b.store.ObjectStorage.Objects = make(map[plumbing.Hash]plumbing.EncodedObject)
    b.store.ObjectStorage.Commits = make(map[plumbing.Hash]plumbing.EncodedObject)
    b.store.ObjectStorage.Trees = make(map[plumbing.Hash]plumbing.EncodedObject)
    b.store.ObjectStorage.Blobs = make(map[plumbing.Hash]plumbing.EncodedObject)
    b.store.ObjectStorage.Tags = make(map[plumbing.Hash]plumbing.EncodedObject)


    b.sessionMtx.Unlock()
  }
}()
This was better, but memory usage was still pretty high and appeared to be growing steadily.
With tests running every 15s, and cleanup every 10, we should only really be holding the blobs for one test cycle at a time. This should be around 30MB or so, given the three variants of files we were working with. So why were we using 1GB of memory?
It call came down to how Go’s garbage collector operates. The garbage collector runs periodically to clean up the heap, and how frequently it runs is determined based on a tradeoff between CPU time and memory usage.
Luckily, we’re not stuck with the defaults, and over the years, Go has added a couple of controls we can tweak. I set the GC configuration env vars to be a little more aggressive and try to keep memory usage below 200MB - playing it safe and leaving some overhead above our expected 30MB.
GOGC=50
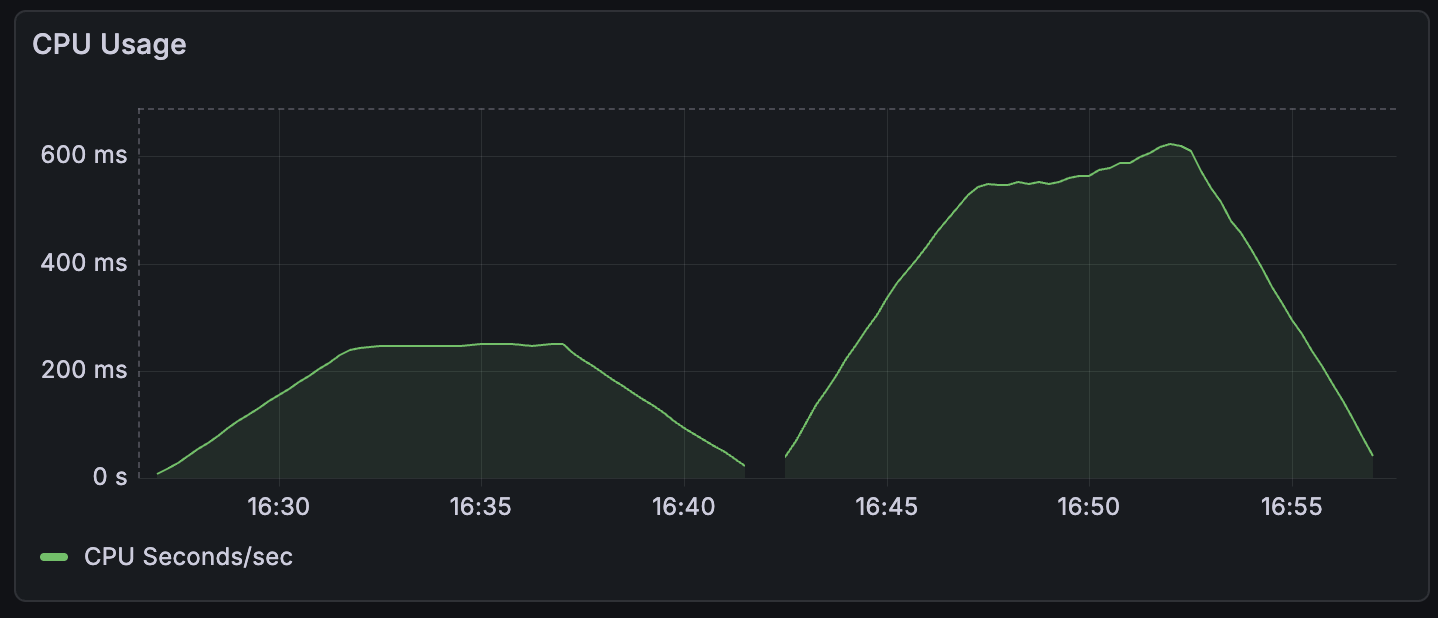
GOMEMLIMIT=200MiBThis made a huge difference to overall memory usage.
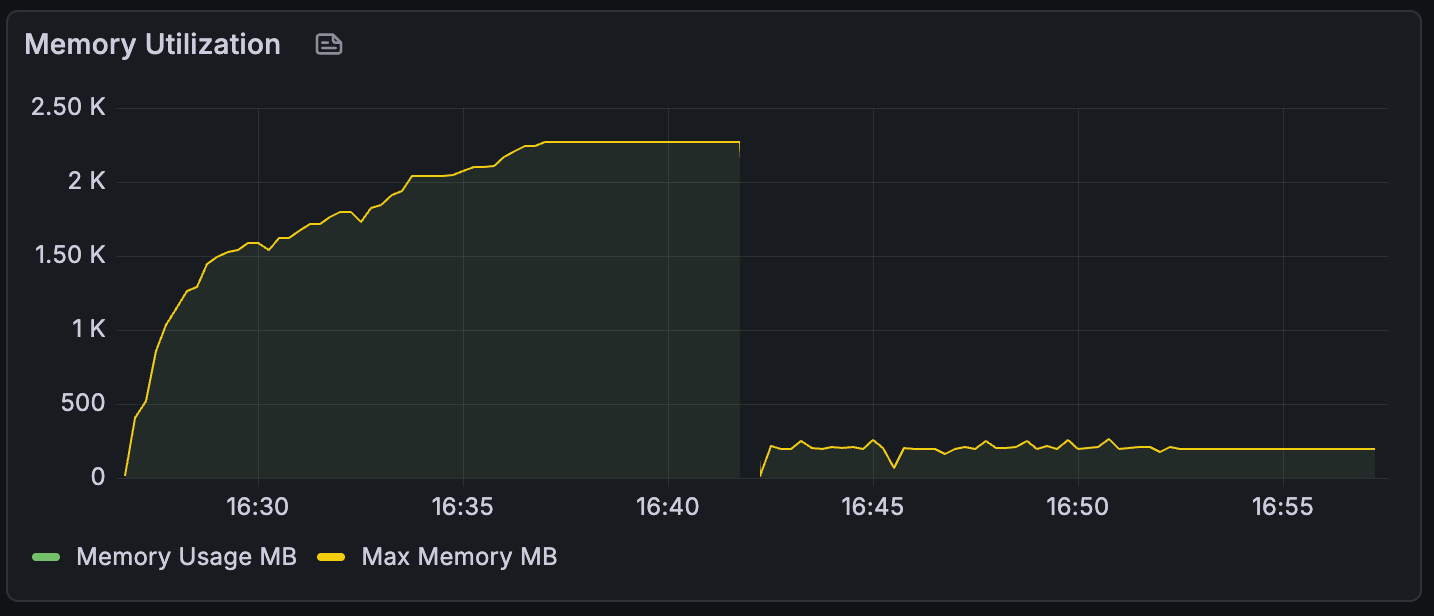
This of course came with a tradeoff, which was a sizeable increase in CPU usage. Depending on the resources available in production, the GC configuration could be tuned to balance these two out.
So now I had a REST server backed by a Git repo that could handle a steady stream of requests over time while keeping request duration and resource utilization reasonably steady. But how did this compare to more well-established storage backends like S3?
Comparing to S3
I still had the S3 backend code from part 1, so I swapped that in and re-ran my test. The below graphs show the last three runs, the first two being git-backed and the last being S3 powered.
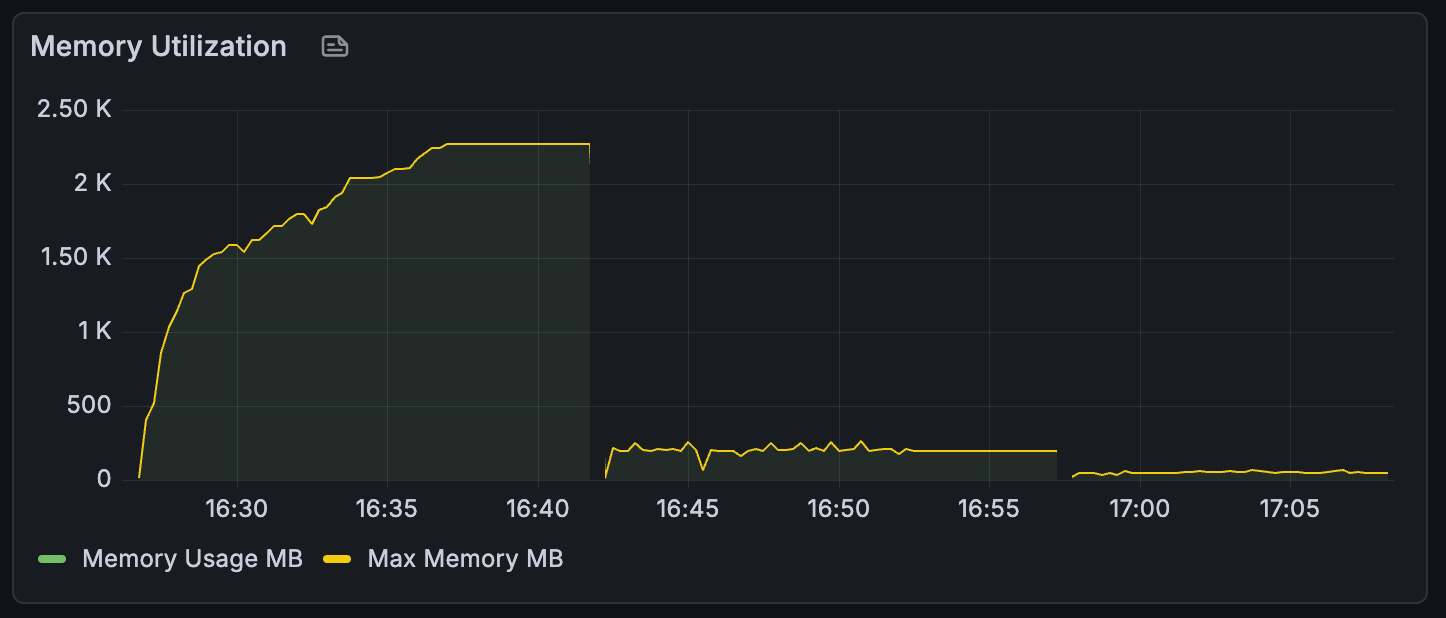
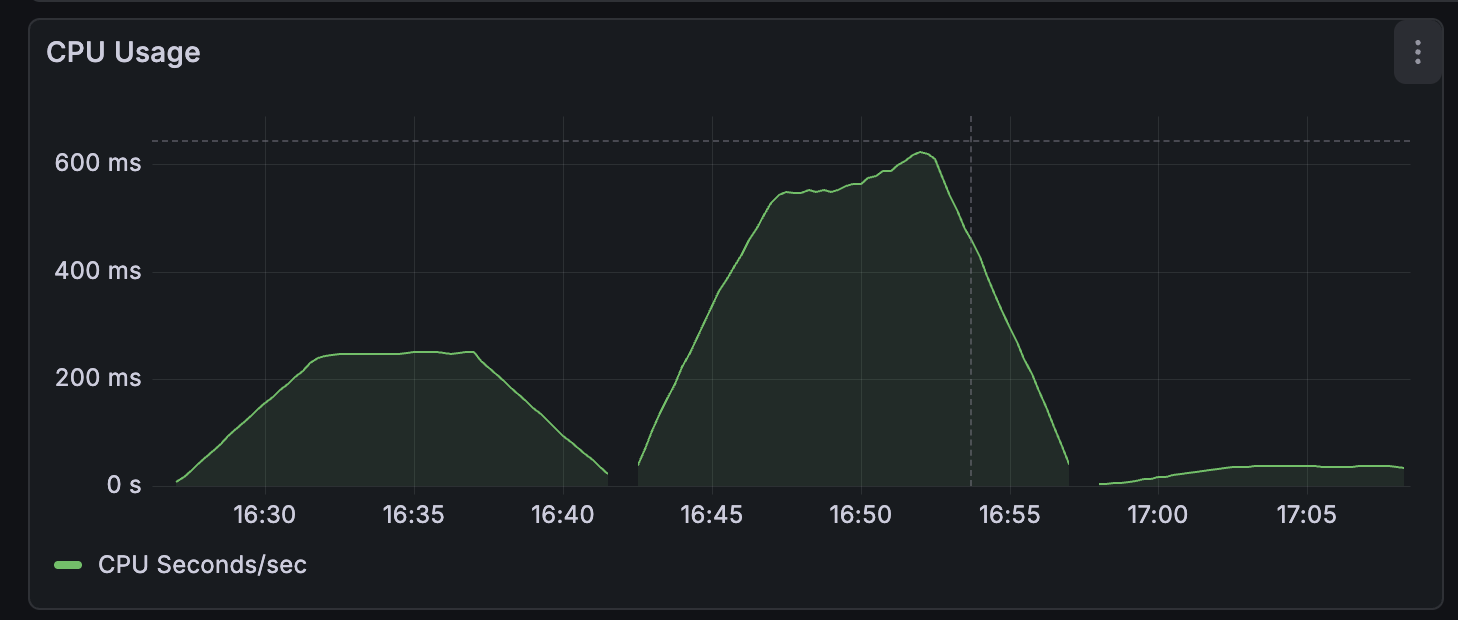
So the S3 client wins out significantly when it comes to both memory and cpu usage. Which makes sense, S3 is designed to be used this way. A git implementation could probably get closer to this level of performance by swapping out go-git for a custom implementation without an object store on the heap. But that would be another project entirely.
What’s next?
I think over the past month or so, I’ve shown that you could use Git as a storage layer for an API. But this comes with a good number of problems to overcome, which potentially represents a decent amount of work. This isn’t entirely surprising, since Git and the go-git library weren’t exactly designed to be used this way.
Now we know it’s kind of, sort of possible, does it ever actually make sense to use Git like this? Next time, I’ll look at a few final considerations, potential use cases and make some final conclusions.